The second initiative was to experiment with resistivity
over a part of the palatial complex on the high southern side
of the city (Figs 4 and 5). Here the so-called Audience Hall
and Ashlar Building were selected as the focus because they
had been partially excavated in earlier seasons. White patches
represent dummy data over trench backfill or stony ground where
readings could not be obtained. The aim was to determine whether
this electrical method would produce significantly clearer imagery
than the fluxgate gradiometer survey. Results were very encouraging,
although there would have been advantages in working at this
location earlier in the season when the ground surface was moister.
Comparison of the two images (Fig. 5) shows that resistivity
survey reveals many smaller buildings which in magnetic survey
are partially masked by magnetic signals from the underlying
geology. This area will be the main target of resistivity survey
at Kerkenes in the spring of 2007. Resistivity survey of this
palatial complex should lead to an understanding of its internal
divisions and thus allow spatial analysis of the many disparate
free standing structures within the enclosing walls.
Even if technical problems encountered with equipment has reduced
the efficiency of the survey, continuation of the resistivity
survey over several future campaigns is unquestionably worth
the investment in time and resources. Refining the Urban Plan
A tentative plan of all the urban blocks in the ancient city
has been drawn from the combination of air photographs, GPS
micro-topographic survey and the geophysical data. In 2006 the
entire southwestern quarter of this plan was checked on the
ground with the aid of a hand-held GPS receiver and revised
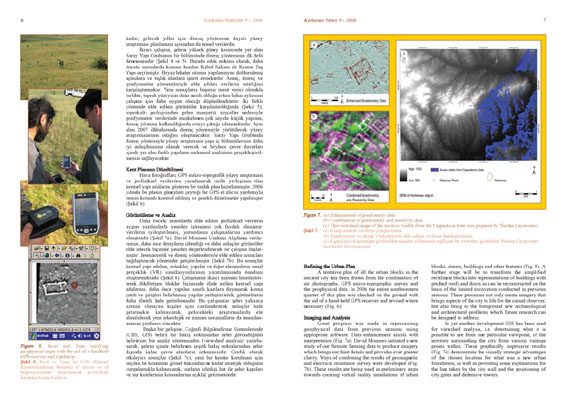
where necessary (Fig. 6).Imaging and Analysis
Great progress was made in reprocessing geophysical data from
previous seasons using appropriate software. Data enhancement
assists with interpretation (Fig. 7a). David Monsees initiated
a new study of our Remote Sensing data to produce imagery which
brings out faint details and provides ever greater clarity.
Ways of combining the results of geomagnetic and electrical
resistance survey were developed (Fig. 7b). These results are
being used in preliminary steps towards creating virtual reality
simulations of urban blocks, streets, buildings and other features
(Fig. 8e). A further stage will be to transform the simplified
rectilinear blocks into representations of buildings with pitched
roofs and doors as can be reconstructed on the basis of the
limited excavation conducted in previous seasons. These processes
not only create imagery that brings aspects of the city to life
for the casual observer, but also bring to the foreground new
archaeological and architectural problems which future research
can be designed to address.
In yet another development GIS has been used for viewshed analysis,
i.e. determining what it is possible to see from one particular
viewpoint, of the territory surrounding the city from various
vantage points within. These graphically impressive results
(Fig. 7c) demonstrate the visually strategic advantages of the
chosen location for what was a new urban foundation, as well
as providing some explanations for the line taken by the city
wall and the positioning of city gates and defensive towers.